Gold Finger
Sitting with me in nunge at home, Eddy Levin handed me a sheet of white paper and asked me to write out my name in capital letters. Levin, who is 75 years old and has a donnish face with grey stubble and a long forehead, used to be a dentist. He lives in East Finchley, north London, on a street that is the epitome of prosperous and conservative suburban Britain. Expensive cars sat in the driveways of between-the-wars brick houses with freshly trimmed hedges and bright green lawns. I took the paper and wrote: ALEX BELLOS.
Levin then picked up a stainless-steel instrument that looked like a small claw, with three prongs. With a steady hand he held it up to the paper and started to analyse my script. He lined up the instrument to the E in my first name with the concentration of a rabbi preparing a circumcision.
‘Pretty good,’ he said.
Levin’s claw is his own invention. The three
prongs are positioned in such a way that the tips of the prongs
stay on the same line and in the same ratio to each other when the
claw opens out. He designed the instrument so that the distance
between the middle prong and the prong above it is always 1.618
times the distance between the middle prong and the prong below it.
Because this number is better known as the golden mean he calls his
tool the Golden Mean Gauge. (Other synonyms for 1.618 include the
golden ratio, the divine proportion and  , or phi.) Levin put the gauge
on my letter E so that the tip of one claw was on the top
horizontal bar of the E, the middle tip was on the middle bar of
the E and the bottom tip was on the bottom bar. I had assumed that
when I wrote a capital E I positioned the middle bar equidistant
between the top and the bottom, but Levin’s gauge showed that I was
subconsciously placing the bar slightly above halfway – in such a
way that it divided the height of the letter into two sections with
lengths of ratio 1 to 1.618. Although I had scribbled my name with
gay abandon, I had adhered to the golden mean with uncanny
precision.
, or phi.) Levin put the gauge
on my letter E so that the tip of one claw was on the top
horizontal bar of the E, the middle tip was on the middle bar of
the E and the bottom tip was on the bottom bar. I had assumed that
when I wrote a capital E I positioned the middle bar equidistant
between the top and the bottom, but Levin’s gauge showed that I was
subconsciously placing the bar slightly above halfway – in such a
way that it divided the height of the letter into two sections with
lengths of ratio 1 to 1.618. Although I had scribbled my name with
gay abandon, I had adhered to the golden mean with uncanny
precision.
Levin smiled and moved on to my S. He readjusted the gauge so that the side points touched the topmost and bottommost tips of the letter and, to my further amazement, the middle one coincided exactly with the S line as it curved.
‘Spot on,’ Levin said calmly. ‘Everybody’s handwriting is in the golden proportion.’
The golden mean is the number that describes the precise ratio when a line is cut into two sections in such a way that the proportion of the entire line to the larger section is equal to the proportion of the larger section to the smaller section. In other words, when the ratio of A + B to A is equal to the ratio of A to B:

A line divided into two by the golden ratio is
known as a golden section, and phi, the ratio between larger and
smaller sections, can be calculated as  . This is an irrational
number, whose decimal expansion begins:
. This is an irrational
number, whose decimal expansion begins:
1.61803 39887 49894 84820…
The Greeks were fascinated by phi. They discovered it in the five-pointed star, or pentagram, which was a revered symbol of the Pythagorean Brotherhood. Euclid called it the ‘extreme and mean ratio’ and he provided a method to construct it with compass and straightedge. Since at least the Renaissancehe number has intrigued artists as well as mathematicians. The major work on the golden ratio was Luca Pacioli’s The Divine Proportion in 1509, which listed the appearance of the number in many geometric constructions, and was illustrated by Leonardo da Vinci. Pacioli concluded that the ratio was a message from God, a source of secret knowledge about the inner beauty of things.
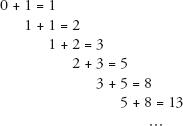
Mathematical interest in phi comes from how it is related to the most famous sequence in maths: the Fibonacci sequence, which is the sequence that starts with 0, 1 and each subsequent term is the sum of the two previous terms:
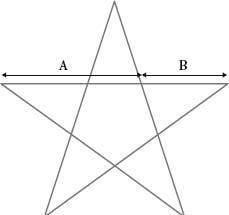
The pentagram, a mystical symbol since ancient times, contains the golden ratio.
0, 1, 1, 2, 3, 5, 8, 13, 21, 34, 55, 89, 144, 233, 377…
Here is how the numbers are found:
Before I show how phi and Fibonacci are connected, let’s investigate the numbers in the sequence. The natural world has a predilection for Fibonacci numbers. If you look in the garden, you will discover that for most flowers the number of petals is a Fibonacci number:
|
3 petals |
lily and iris |
|
5 petals |
pink and buttercup |
|
8 petals |
delphinium |
|
13 petals |
marigold and ragwort |
|
21 petals |
aster |
|
55 petals/89 petals |
daisy |
The flowers may not always have these numbers of petals, but the average number of petals will be a Fibonacci number. For example, there are usually three leaves on a stem of clover, a Fibonacci number. Only seldom do clovers have four leaves, which is why we consider them special. Four-leaf clovers are rare because 4 is not a Fibonacci number.
Fibonacci numbers also occur in the spiral arrangements on the surfaces of pine cones, pineapples, cauliflower and sunflowers. As the picture below shows, you can count spirals clockwise and anticlockwise. The numbers of spirals you can count in both directions are consecutive Fibonacci numbers. Pineapples usually have 5 and 8 spirals, or 8 and 13 spirals. Spruce cones tend to have 8 and 13 spirals. Sunflowers can have 21 and 34, or 34 and 55 spirals – although examples as high as 144 and 233 have been found. The more seeds there are, the higher up the sequnce the spirals will go.
The Fibonacci sequence is so called because the terms appear in Fibonacci’s Liber Abaci, in a problem about rabbits. The sequence only gained the name, however, more than 600 years after the book was published when, in 1877, the number theorist Edouard Lucas was studying it, and he decided to pay tribute to Fibonacci by naming the sequence after him.
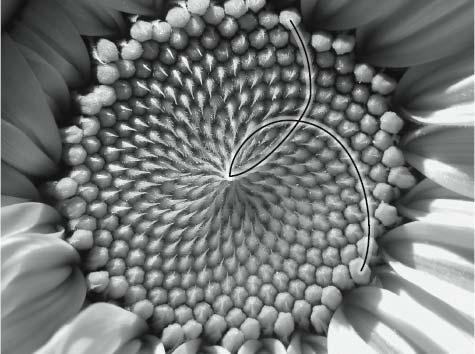
A sunflower with 34 anticlockwise and 21 clockwise spirals.
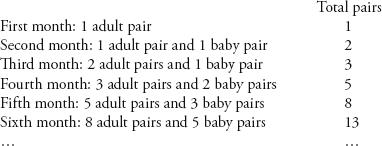
The Liber Abaci set up the sequence like this: say that you have a pair of rabbits, and after one month the pair gives birth to another pair. If every adult pair of rabbits gives birth to a pair of baby rabbits every month, and it takes one month for the baby rabbits to become adults, how many rabbits are produced from the first pair in a year?
The answer is found by counting rabbits month by month. In the first month, there is just one pair. In the second there are two, as the original pair have given birth to a pair. In the third month there are three, since the original pair have again bred, but the first pair are only just adults. In the fourth month the two adult pairs breed, adding two to the population of three. The Fibonacci sequence is the month-on-month total of pairs:
An important feature of the Fibonacci sequence is that it is recurrent, which means that each new term is generated by the values of previous terms. This helps explain why the Fibonacci numbers are so prevalent in natural systems. Many life forms grow by a process of recurrence.
There are many examples in nature of Fibonacci numbers, and one of my favourites concerns the reproductive patterns of bees. A male bee, or drone, has just one parent: his mother. Female bees, however, have two parents: a mother and a father. So, a drone has three grandparents, five great-grandparents, eight great-grandparents, and so on. Plotting a chart of the drone’s ancestry (as in the diagram overleaf), we find that the number of relatives he has per generation is always a Fibonacci number.
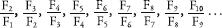
In addition to its association with fruit, promiscuous rodents and flying insects, the Fibonacci sequence has many absorbing mathematical properties. Listing the first 20 numbers will help us see the patterns. Each Fibonacci number is traditionally written using an F with a subscript to denote the position of that number in the sequence:
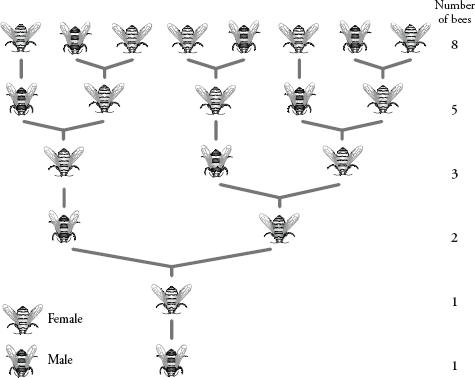
A chart tracing the ancestral history of one male bee (shown at the bottom).
|
(F0 |
0) |
|
F1 |
1 |
|
F2 |
1 |
|
F3 |
2 > |
|
F4 |
3 |
|
F5 |
5 |
|
F6 |
8 |
|
F7 |
13 |
|
F8 |
21 |
|
F9 |
34 |
|
F |
55 |
|
F11 |
89 |
|
F12 |
144 |
|
F13 |
233 |
|
F14 |
377 |
|
F15 |
610 |
|
F16 |
987 |
|
F17 |
1597 |
|
F18 |
2584 |
|
F19 |
4181 |
|
F20 |
6765 |
Upon closer examination, we see that the sequence regenerates itself in many surprising ways. Look at F3, F6, F9,…, in other words, every third F-number. They are all divisible by 2. Compare this with F4, F8, F12,…, or every fourth F-number – they are all divisible by 3. Every fifth F-number is divisible by 5; every sixth F-number, divisible by 8; and every seventh number by 13. The divisors are precisely the F-numbers in sequence.
Another amazing example comes from  , or
, or  . This number is
equal to the sum of:
. This number is
equal to the sum of:
.0
.01
.001
.0002
.000005
.0000008
.00000013
.000000021
.0000000034
.00000000055
.000000000089
.0000000000144
So, the Fibonacci sequence pops its head up again.
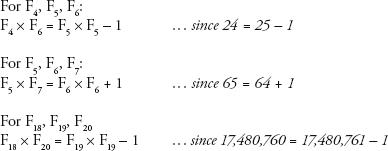
Here’s another interesting mathematical property of the sequence. Take any three consecutive F-numbers. The first one multiplied by the third one is always one different from the second one squared:
This property is the basis of a centuries-old magic trick, in which it is possible to cut up a square of 64 unit squares into four pieces and reassemble them to make a square of 65 pieces. Here’s how it’s done: draw a square of 64 unit squares. It has a side length of 8. In the sequence, the two F-numbers preceding 8 are 5 and 3. Divide the square up using the lengths of 5 and 3, as in the first image below. The pieces can be reassembled to make a rectangle with sides the length of 5 and 13, which has an area of 65.
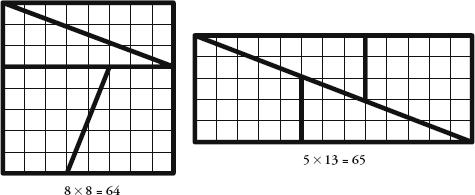
The trick is explained by the fact that the shapes are not a perfect fit. Though it is not that obvious to the naked eye, there is a long thin gap along the middle diagonal with an area of one unit.
It follows that a square of 169 unit squares (13 × 13) can be rearranged to ‘make’ a rectangle of 168 squares (8 × 21). In this case the segments overlap slightly along the middle diagonal.
In the early seventeenth century, the German astronomer Johannes Kepler wrote that: ‘As 5 is to 8, so 8 is to 13, approximately, and as 8 to 13, so 13 is to 21, approximately.’ In other words, he noticed that the ratios of consecutive F-numbers were similar. A century later the Scottish mathematician Robert Simson saw something even more incredible. If you take the ratios of consecutive F-numbers and put them in the sequence:
which is:
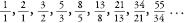
or (to three decimal places):
1, 2, 1.5, 1.667, 1.6, 1.625, 1.615, 1.619, 1.618…
then the values of these terms get closer and closer to phi, the golden ratio.
In other words, the golden ratio is approximated by the ratio of consecutive Fibonacci numbers, with the approximation increasing in accuracy further down the sequence.
Now let’s continue with this line of thought and consider a Fibonacci-like sequence, starting with two random numbers, and then adding consecutive terms to continue the sequence. So, just say we start with 4 and 10, the following term will be 14 and the one after that 24. Our example gives us:
4, 10, 14, 24, 38, 62, 100, 162, 262, 424…
Look at the ratios of consecutive terms:

The Fibonacci recurrence algorithm of adding two consecutive terms in a sequence to make the next one is so powerful that whatever two numbers you start with, the ratio of consecutive terms always converges to phi. I find this a totally enthralling mathematical phenomenon.
The ubiquity of Fibonacci numbers in nature means that phi is also ever present in the world. Which brings us back to the retired dentist, Eddy Levin. Early in his career he spent a lot of time making false teeth, which he found a very frustrating job because no matter how he arranged the teeth he could not make a person’s smile look right. ‘I sweated blood and tears,’ he said. ‘Whatever I did the teeth looked artificial.’ But at around that time Levin started attending a maths and spirituality class, where he learned about phi. Levin was made aware of Pacioli’s The Divine Proportion and was inspired. What if phi, which Pacioli claimed revealed true beauty, also held the secret of divine dentures? ‘It was a Eureka moment,’ he said. It was 2 a.m. and he rushed to his study. ‘I spent the rest of the night measuring teeth.’
Levin scoured photographs and discovered that in the most attractive sets of teeth, the big top front tooth (the central incisor) was wider than the one next to it (the lateral incisor) by a factor of phi. The lateral incisor was also wider than the adjacent tooth (the canine) by a factor of phi. And the canine was wider than one next to it (the first premolar) by a factor of phi. Levin wasn’t measuring the size of actual teeth, but the size of teeth in pictures when taken head-on. Still, he felt like he had made an historic discovery: the beauty of a perfect smile was prescribed by phi.
‘I was very excited,’ remembered Levin. At work, he mentioned his findings to colleagues, but they dismissed him as an oddball. He continued to develop his ideas nonetheless, and in 1978 he published an article expounding them in the Journal of Prosthetic Dentistry. ‘From then, people got interested in it,’ he said. ‘Now there is not a lecture that is given on [dental] aesthetics that doesn’t include a section on the golden proportion.’ Levin was using phi so much in his work that in the early 1980s he asked an engineer to design him an instrument that could tell him if two teeth were in the golden proportion. The result was the three-pronged Golden Mean Gauge. He still sells them to dentists around the world.
I couldn’t tell if Levin’s own teeth were in the golden proportion, although there was certainly a fair amount of gold in them. Levin told me his gauge became more than a work tool, and he started to measure objects other than teeth. He found phi in the patterns of flowers, in the spread of branches along stems, and in leaves along branches. He took it with him on holiday and found phi in the proportions of buildings. He also found phi in the rest of the human body, in the length of knuckles to fingers and in the relative positions of the nose, teeth and chin. Additionally, he noticed that most people use phi in their handwriting, just as hown in mine.
The more Levin looked for phi, the more he found it. ‘I found so many coincidences, I started to wonder what it was all about.’ He opened his laptop and showed me a slideshow of images, each with the three points of the gauge showing exactly where the ratio was to be found. I saw pictures of butterfly wings, peacock feathers and animal colourings, the ECG reading of a healthy human heart, paintings by Mondrian and a car.
When a rectangle is constructed so that the ratio between its sides is phi, you get what is known as a ‘golden rectangle’. This rectangle has the convenient property that if we were to cut it vertically so that one side is a square, then the other side is also a golden rectangle. The mother gives birth to a baby daughter.
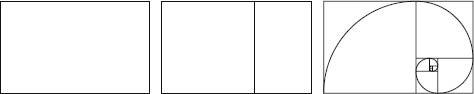
Golden rectangle and logarithmic spiral.
We can continue this process to create granddaughters, great-granddaughters, ad infinitum. Now, let’s draw a quarter-circle in the largest square by using a compass, placing the point at the bottom right corner and moving the pencil from one adjacent corner to the other. Repeat in the second-largest square with the compass point at the bottom left corner, with the pencil continuing the curve for another quarter-circle, and then carry on with the smaller squares. The curve is an approximation of a logarithmic spiral.
A true logarithmic spiral will pass through the same corners of the same squares, yet it will wind itself smoothly, unlike the curve in the diagram, which will have small jumps in curvature where the quarter-circle sections meet. In a logarithmic spiral, a straight line from the centre of the spiral – the ‘pole’ – will cut the spiral curve at the same angle at all points, which is why Descartes called the logarithmic spiral an ‘equiangular spiral’.
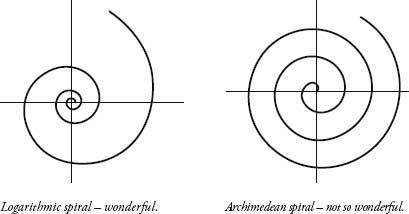
The logarithmic spiral is one of the most bewitching curves in maths. In the seventeenth century Jakob Bernoulli was the first mathematician to investigate its properties thoroughly. He called it the spira mirabilis, the wonderful spiral. He asked to have one engraved on his tombstone, but the sculptor engraved an Archimedean spiral by mistake.
The fundamental property of the logarithmic spiral is that it never changes shape the more it grows. Bernoulli expressed this on his tombstone with the epitaph: Eadem mutata resurgo, or ‘Although changed, I shall arise the same’. The spiral rotates an infinite number of times before reaching its pole. If you took a microscope and looked at the centre of a logarithmic spiral, you would see the same shape that you would see if the logarithmic spiral above was continued until it was as big as a galaxy and you were looking at it from a different solar system. In fact, many galaxies are in the shape of logarithmic spirals. Just like a fractal, a logarithmic spiral is self-similar, that is, any smaller piece of a larger spiral has identical shape to the larger piece.
The most stunning example of a logarithmic spiral in nature is the nautilus shell. As the shell grows, each successive chamber is larger, but has the same shape as the chamber before. The only spiral that can accommodate chambers of different sizes with the same relative dimensions is Bernoulli’s spira mirabilis/span>.
As Descartes noted, a straight line from the pole of a logarithmic spiral always cuts the curve at the same angle, and this feature explains why the spiral is used by Peregrine falcons when they attack their prey. Peregrines do not swoop in a straight line, but rather bear down on prey by spiralling around it. In 2000 Vance Tucker of Duke University figured out why this is so. Falcons have eyes at the sides of their head, which means that if they want to look in front of themselves, they need to turn their head 40 degrees. Vance tested falcons in a wind tunnel and showed that with their head at such an angle, the wind drag on a falcon is 50 percent greater than it would be if they were looking straight ahead. The path that lets the bird keep its head in the most aerodynamic position possible, while also enabling it to constantly look at the prey at the same angle, is a logarithmic spiral.
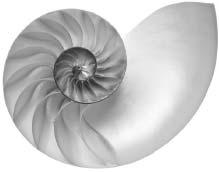
Nautilus shell.
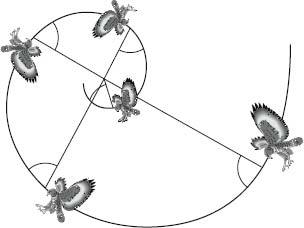
Falcons descend on their prey in a logarithmic spiral.
Plants, as well as birds of prey, move to the music of phi. When a plant grows, it needs to position its leaves around the stem in such a way as to maximize the amount of sunlight that falls on each leaf. That’s why plant leaves aren’t directly above each other; if that were the case, the bottom ones would get no sunlight at all.
As the stem goes higher, each new leaf appears at a fixed angle around the stem from the previous leaf. The stem sprouts a leaf at a predetermined rotation, as in the diagram on the following page.
What is the fixed angle that maximizes sunlight for the leaves, the angle that will spread out the leaves around the stem so that they overlap as little as possible? It is not 180 degrees, or a half turn, because the third leaf would be directly above the first. The angle is not 90 degrees, or a quarter turn, because if this were the case, the fifth leaf would be directly over the first – and also the first three leaves would be using only one side of the stem, which would be a waste of the sunlight available on the other side. The angle that provides the best arrangement is 137.5 degrees, and the diagram above shows where the leaves would be positioned if successive leaves are always separated by this angle. The first three leaves are positioned well apart from each other. The next two, leaves four and five, are separated by more than 50 degrees from their nearest leaves, which still gives them a good amount of room. The sixth leaf is at 32.5 degrees from the first. This is closer to a leaf than any previous one, which it has to be since there are more leaves, yet the distance is still a pretty wide berth.
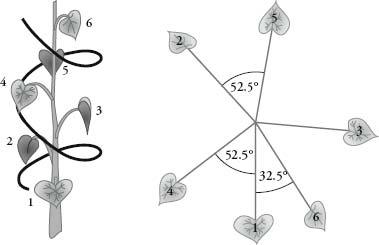
How leaves spiral up a stem.
The angle of 137.5 degrees is known as the golden angle. It is the angle we get when we divide the full rotation of a circle according to the golden ratio. In other words when we divide 360 degrees into two angles such that the ratio of the larger angle to the smaller angle is phi, or 1.618. The two angles are 222.5 degrees and 137.5 degrees, to one decimal place. The smaller one is known as the golden angle.
The mathematical reason why the golden angle produces the best leaf arrangement around a stem is linked to the concept of irrational numbers, which a those numbers that cannot be expressed as fractions. If an angle is an irrational number, no matter how many times you turn it around a circle you will never get back to where you started. It may sound Orwellian, but some irrational numbers are more irrational than others. And no number is more irrational than the golden ratio. (There’s a brief explanation why in the appendix.)
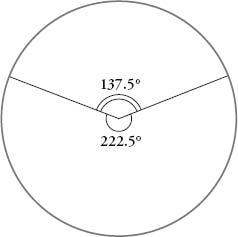
The golden angle.
The golden angle explains why you generally
find on a plant stem that the number of leaves and number of turns
before a leaf sprouts more or less directly above the first one is
a Fibonacci number. For example, roses have 5 leaves every 2 turns,
asters have 8 leaves for every 3 turns and almond trees have 13
leaves every 5 turns. Fibonacci numbers occur because they provide
the nearest whole-number ratios for the golden angle. If a plant
sprouts 8 leaves for every 3 turns, each leaf occurs every
 turn, or
every 135 degrees, a very good approximation for the golden
angle.
turn, or
every 135 degrees, a very good approximation for the golden
angle.
The unique properties of the golden angle are most strikingly seen in seed arrangements. Imagine that a flower head produces seeds from the centre point at a fixed angle of rotation. When new seeds emerge, they push the older seeds further out from the centre. These three diagrams show the patterns of seeds that emerge with three different fixed angles: just below the golden angle, the golden angle, and just above.
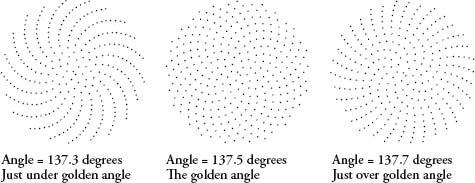
What is surprising is how a tiny change in the angle can cause such a huge variation in the positions of the seeds. At the golden angle, the seed head is a mesmerizing pattern of interlocking logarithmic spirals. It is the most compact arrangement possible. Nature chooses the golden angle because of this compactness – the seeds are bound together more closely and the organism will be stronger because of it.
In the late nineteenth century the German Adolf Zeising most forcefully put forth the view that the golden proportion is beauty incarnate, describing the ratio as a universal law ‘which permeates, as a paramount spiritual ideal, all structures, forms and proportions, whether cosmic or individual, organic or inorganic, acoustic or optical; which finds its fullest realization, however, in the human form’. Zeising was the first person to claim that the front of the Parthenon is in the shape of a golden rectangle. In fact, there is no documentary evidence that those in charge of the architectural project, who included the sculptor Phidias, used the golden ratio. Nor, if you look closely, is the golden rectangle a precise fit. The edges of the pedestal fall outside. Yet it was Phidias’s connection to the Parthenon that, in around 1909, inspired the American mathematician Mark Barr to name the golden ratio phi.
Despite the eccentric tone of Zeising’s work, he was taken seriously by Gustav Fechner, one of the founders of experimental psychology. In order to discover if there was any empirical evidence that humans thought the golden rectangle more beautiful than any other sort of rectangle, Fechner devised a test in which subjects were shown a number of different rectangles and asked which they preferred.
Fechner’s results appeared to vindicate Zeising. The rectangle closest to a golden one was the top choice, favoured by just over a third of the sample group.ven though Fechner’s methods were crude, his rectangle-testing began a new scientific field – the experimental psychology of art – as well as the narrower discipline of ‘rectangle aesthetics’. Many psychologists have conducted similar surveys on the attractiveness of rectangles, which is not as absurd as it sounds. If there were a ‘sexiest’ rectangle, this shape would be of use to the designers of commercial products. Indeed, credit cards, cigarette packets and books often approach the proportions of a golden rectangle. Unfortunately for phi-philes, the most recent and detailed piece of research, by a team led by Chris McManus of University College London, suggests that Fechner was wrong. The 2008 paper stated that ‘more than a century of experimental work has suggested that the golden section actually plays little normative role in subjects’ preferences for rectangles’. Yet the authors did not conclude that analysing rectangle preference is a waste of time. Far from it. They claimed that while no one rectangle is universally preferred by humans, there are important individual differences in the aesthetic appreciation of rectangles that merit further investigation.
Lesser scientists than Fechner were also inspired by Zeising’s theories. Frank A. Lonc from New York measured the height of 65 women compared to the height of their belly buttons and discovered that the ratio was 1.618. He had excuses when it wasn’t: ‘Subjects whose measurements did not fall within this ratio testified to hip injuries or other deforming accidents in childhood.’ The French architect Le Corbusier created ‘Modulor man’ in order to use proper proportions in architecture and design. In his man, the ratio of the height of the man to the height of his belly button is 1829/1130, or 1.619, and the ratio of the distance between his belly button and his upheld right hand and his belly button and his head is 1130/698, again 1.619. Le Corbusier’s intention for the Modulor was to use these proportions in architecture and design.
Gary Meisner is a 53-year-old business consultant from Tennessee. He calls himself the Phi Guy and on his website sells merchandise including phi T-shirts and mugs. His bestselling product, however, is the PhiMatrix, a piece of software that creates a grid on your computer screen to check images for the golden ratio. Most purchasers use it as a design tool to make cutlery, furniture and homes. Some customers use it for financial speculation by superimposing the grid on graphs of indices and using phi to predict future trends. ‘A guy in the Caribbean was using my matrix to trade in oil, a guy in China was using it to trade in currencies,’ he said. Meisner was drawn to the golden mean because he is spiritual and says it helped him understand the universe, but even the Phi Guy thinks that his fellow travellers can go too far. He is, for example, unconvinced by the traders. ‘When you look back on the market it is pretty easy to find relationships that conform to phi,’ he said. ‘The challenge is that looking backwards is completely different to looking out the front window.’ Meisner’s website has made him the go-to guy for every flavour of phi aficionado. He told me that a month ago he received an email from an unemployed man who believed that the only way to get a job interview was to design his résumé in the proportions of the golden ratio. Meisner felt the man was deluded and took pity on him. He gave him some phi design tips, but suggested that it would be more fruitful investing in more traditional job-hunting methods such as business networking. ‘I got a letter from him this morning,’ Meisner blurted. ‘He said he has a job interview. He is giving credit to the résuménew design!’
Back in London I told Eddy Levin the story of the golden résumé as an example of excessive eccentricity. Levin, however, didn’t think it was funny. In fact, he agreed that a phi-proportioned résumé was better than a regular one. ‘It would look more beautiful, and so the reader would be more attracted to it.’
After 30 years of studying the golden ratio, Levin is convinced that wherever there is beauty, there will be phi. ‘Any art which looks good, the dominant proportions are the golden proportion,’ he said. He knows this is an unpopular viewpoint, as it prescribes a formula for beauty, but he guarantees he will be able to find phi in any piece of art.
My instinctive reaction to Levin’s phi obsession was one of scepticism. For a start, I was unconvinced that his gauge was accurate enough to measure 1.618 sufficiently precisely. It was not surprising to find a ratio of ‘approximately phi’ in a painting or a building, especially if you could select which parts to choose. Also, since the ratio of consecutive Fibonacci numbers makes a good approximation to 1.618, whenever there is a grid of 5×3 or 8×5 or 13×8 and so on, you will see a golden rectangle. Of course the ratio will be a common one.
Yet there was something compelling about Levin’s examples. I felt the thrill of wonder with each new image he showed me. Phi really was everywhere. Yes, the golden ratio has always attracted cranks, but this in itself did not mean that all the theories were crankish. Some very respectable academics have claimed that phi creates beauty, particularly in the structure of musical compositions. The argument that human beings might be drawn to a proportion that best expresses natural growth and regeneration does not seem too far-fetched.
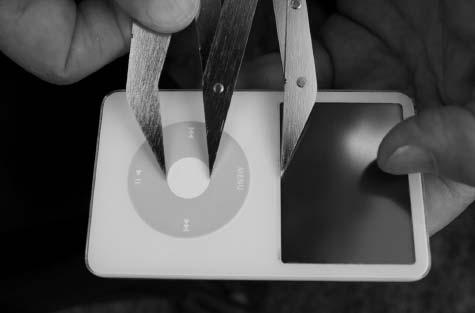
It was a sunny summer’s day and Levin and I relocated to his garden. We sat on two lawn chairs and sipped tea. Levin told me that the limerick was a successful form of poetry because the syllables in its lines (8, 8, 5, 5, 8) are Fibonacci numbers. Then I had an idea. I asked Levin if he knew what an iPod was. He didn’t. I had one in my pocket and I took it out. It was a beautiful object, I said, and according to his reasoning, it should contain the golden ratio.
Levin took my shiny white iPod and held it in his palm. Yes, he replied, it was beautiful, and it should. Not wanting to get my hopes up, he warned me that factory-produced objects often do not follow the golden ratio perfectly. ‘The shape shifts slightly for the convenience of manufacture,’ he said.
Levin opened his callipers and started measuring between all the significant points.
‘Ooh, yes,’ he grinned.